Read attendance and results analytics
Check the scope and data completeness behind the Admin analytics cards before interpreting attendance or result trends.
For Administrator
On this page
Before you begin
- An authorised Admin account with permission to view this area of your school portal.
- The relevant academic year and the class, person or record you intend to check. Demo names, amounts, dates and counts are examples, not current school information.
1. Check the class and selected period
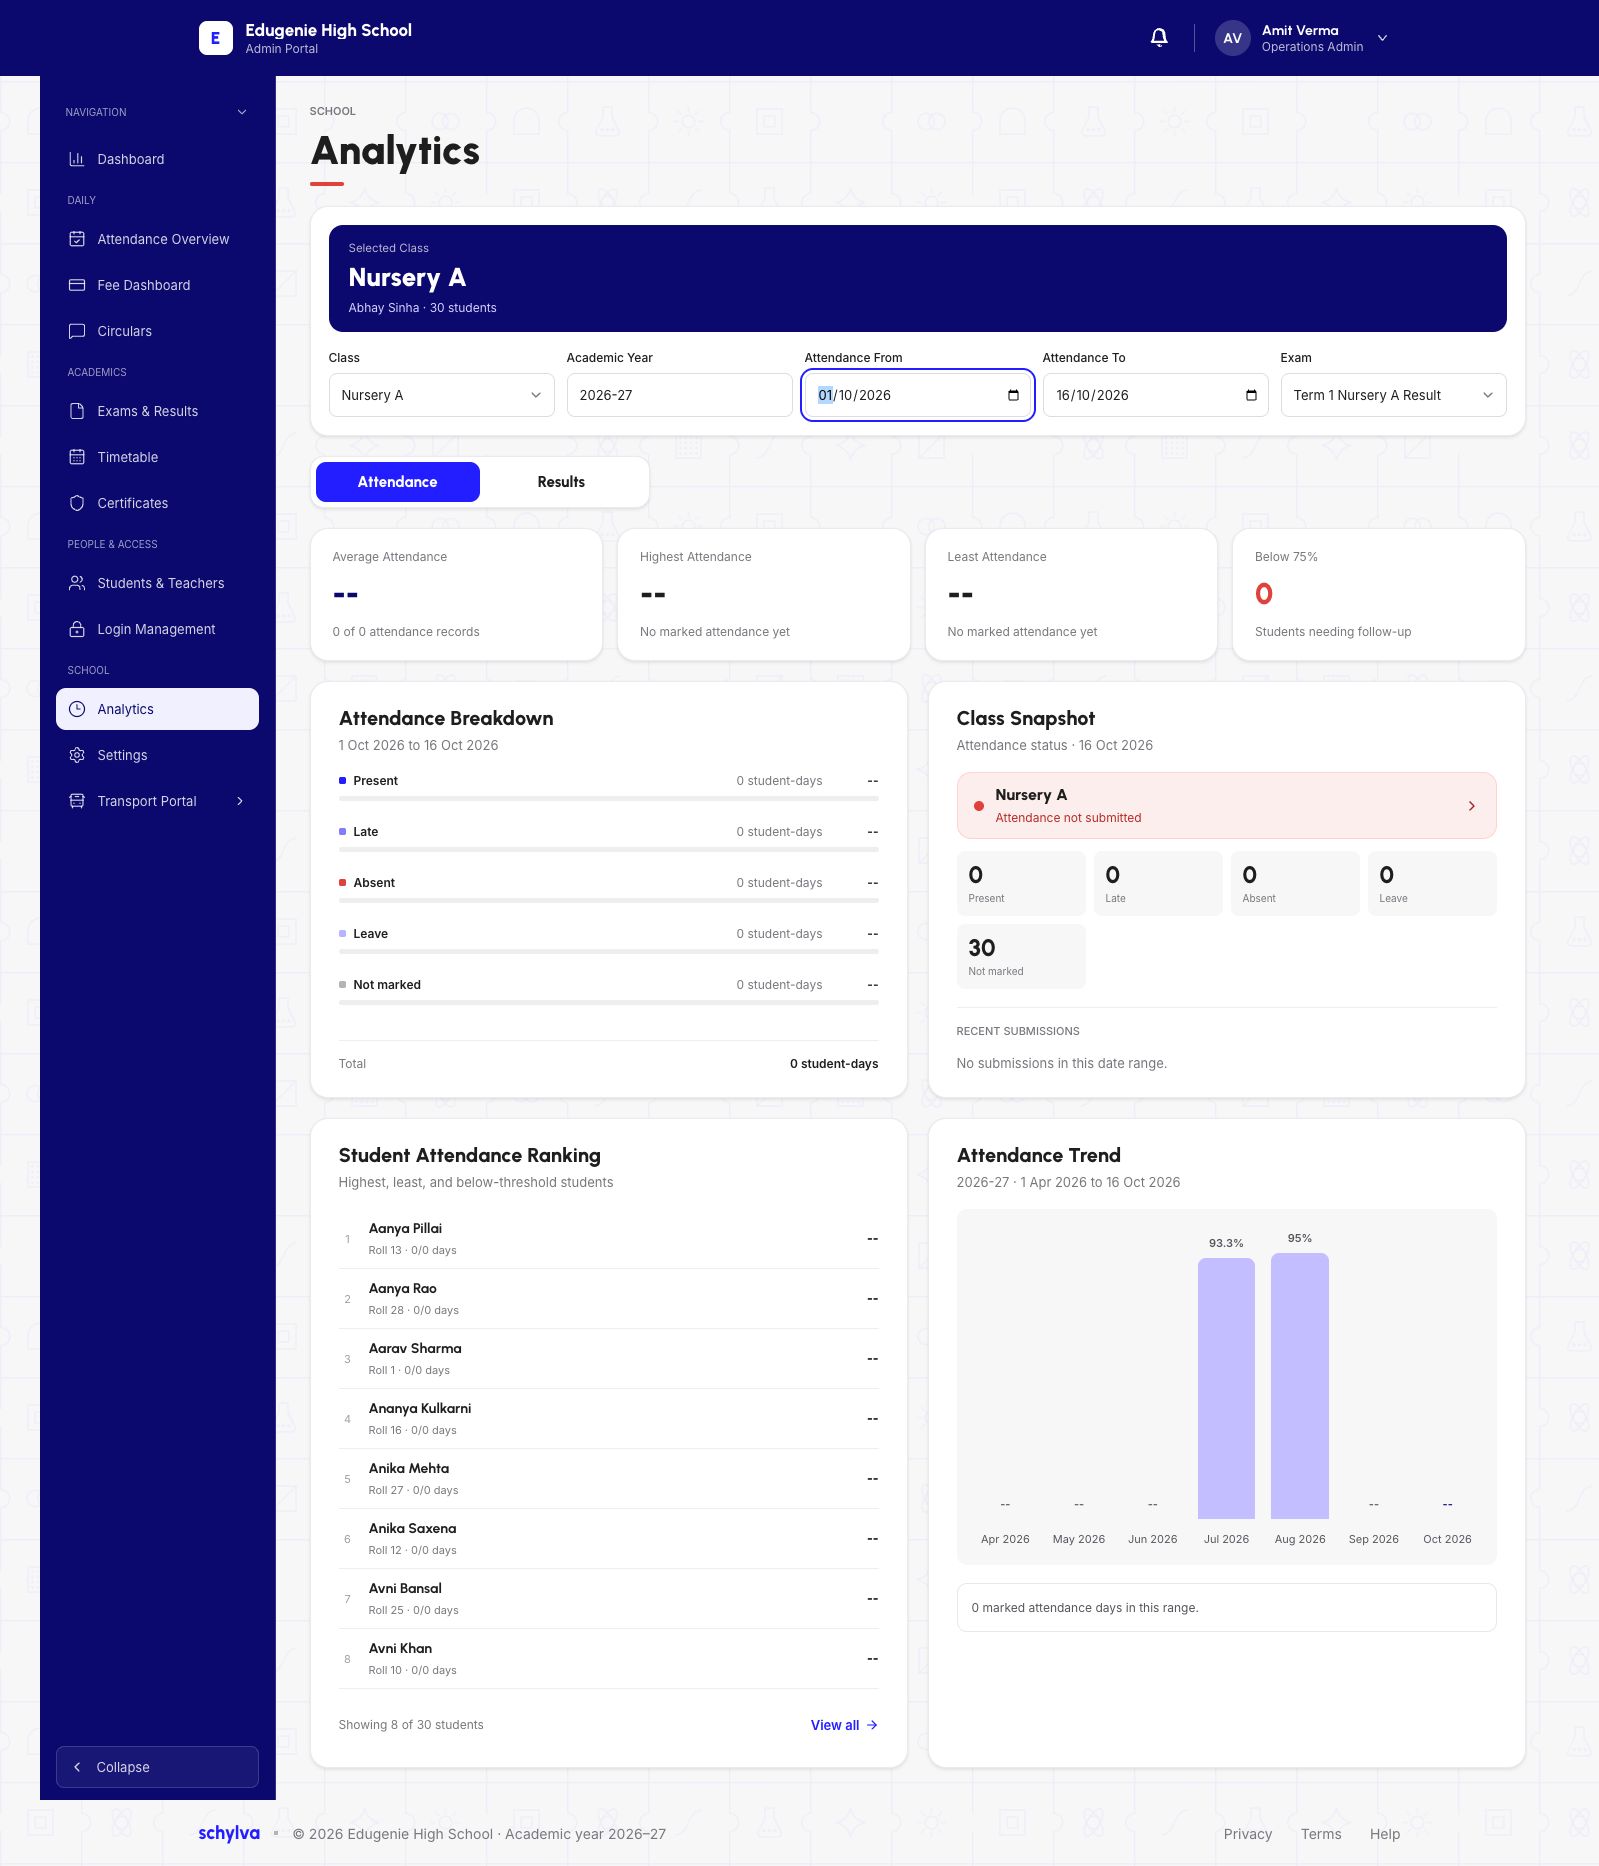
Open Analytics. Check Class and Academic Year, then the Attendance From and To dates. The example selects Nursery A, academic year 2026–27 and 1–16 October 2026.
The page also has an Exam selector for results. Attendance dates and the selected examination serve different purposes; read the heading of the panel you are using.
Demo · Admin desktop web
 View full screenshot
2. Recognise missing attendance data
In the selected October range, several attendance cards show a dash and the breakdown has zero student-days. The class snapshot is Not Submitted with 30 Not Marked.
A zero Below 75% count in this state is not evidence that everyone attended regularly. Likewise, 0/0 days in the ranking is not a measured zero-percent attendance rate.
The Attendance Trend panel is labelled for the academic year, 1 April–16 October. Its July and August bars use a wider period than the October date selection. Read that panel’s range before comparing it with the empty October cards.
3. Inspect the ranking’s coverage
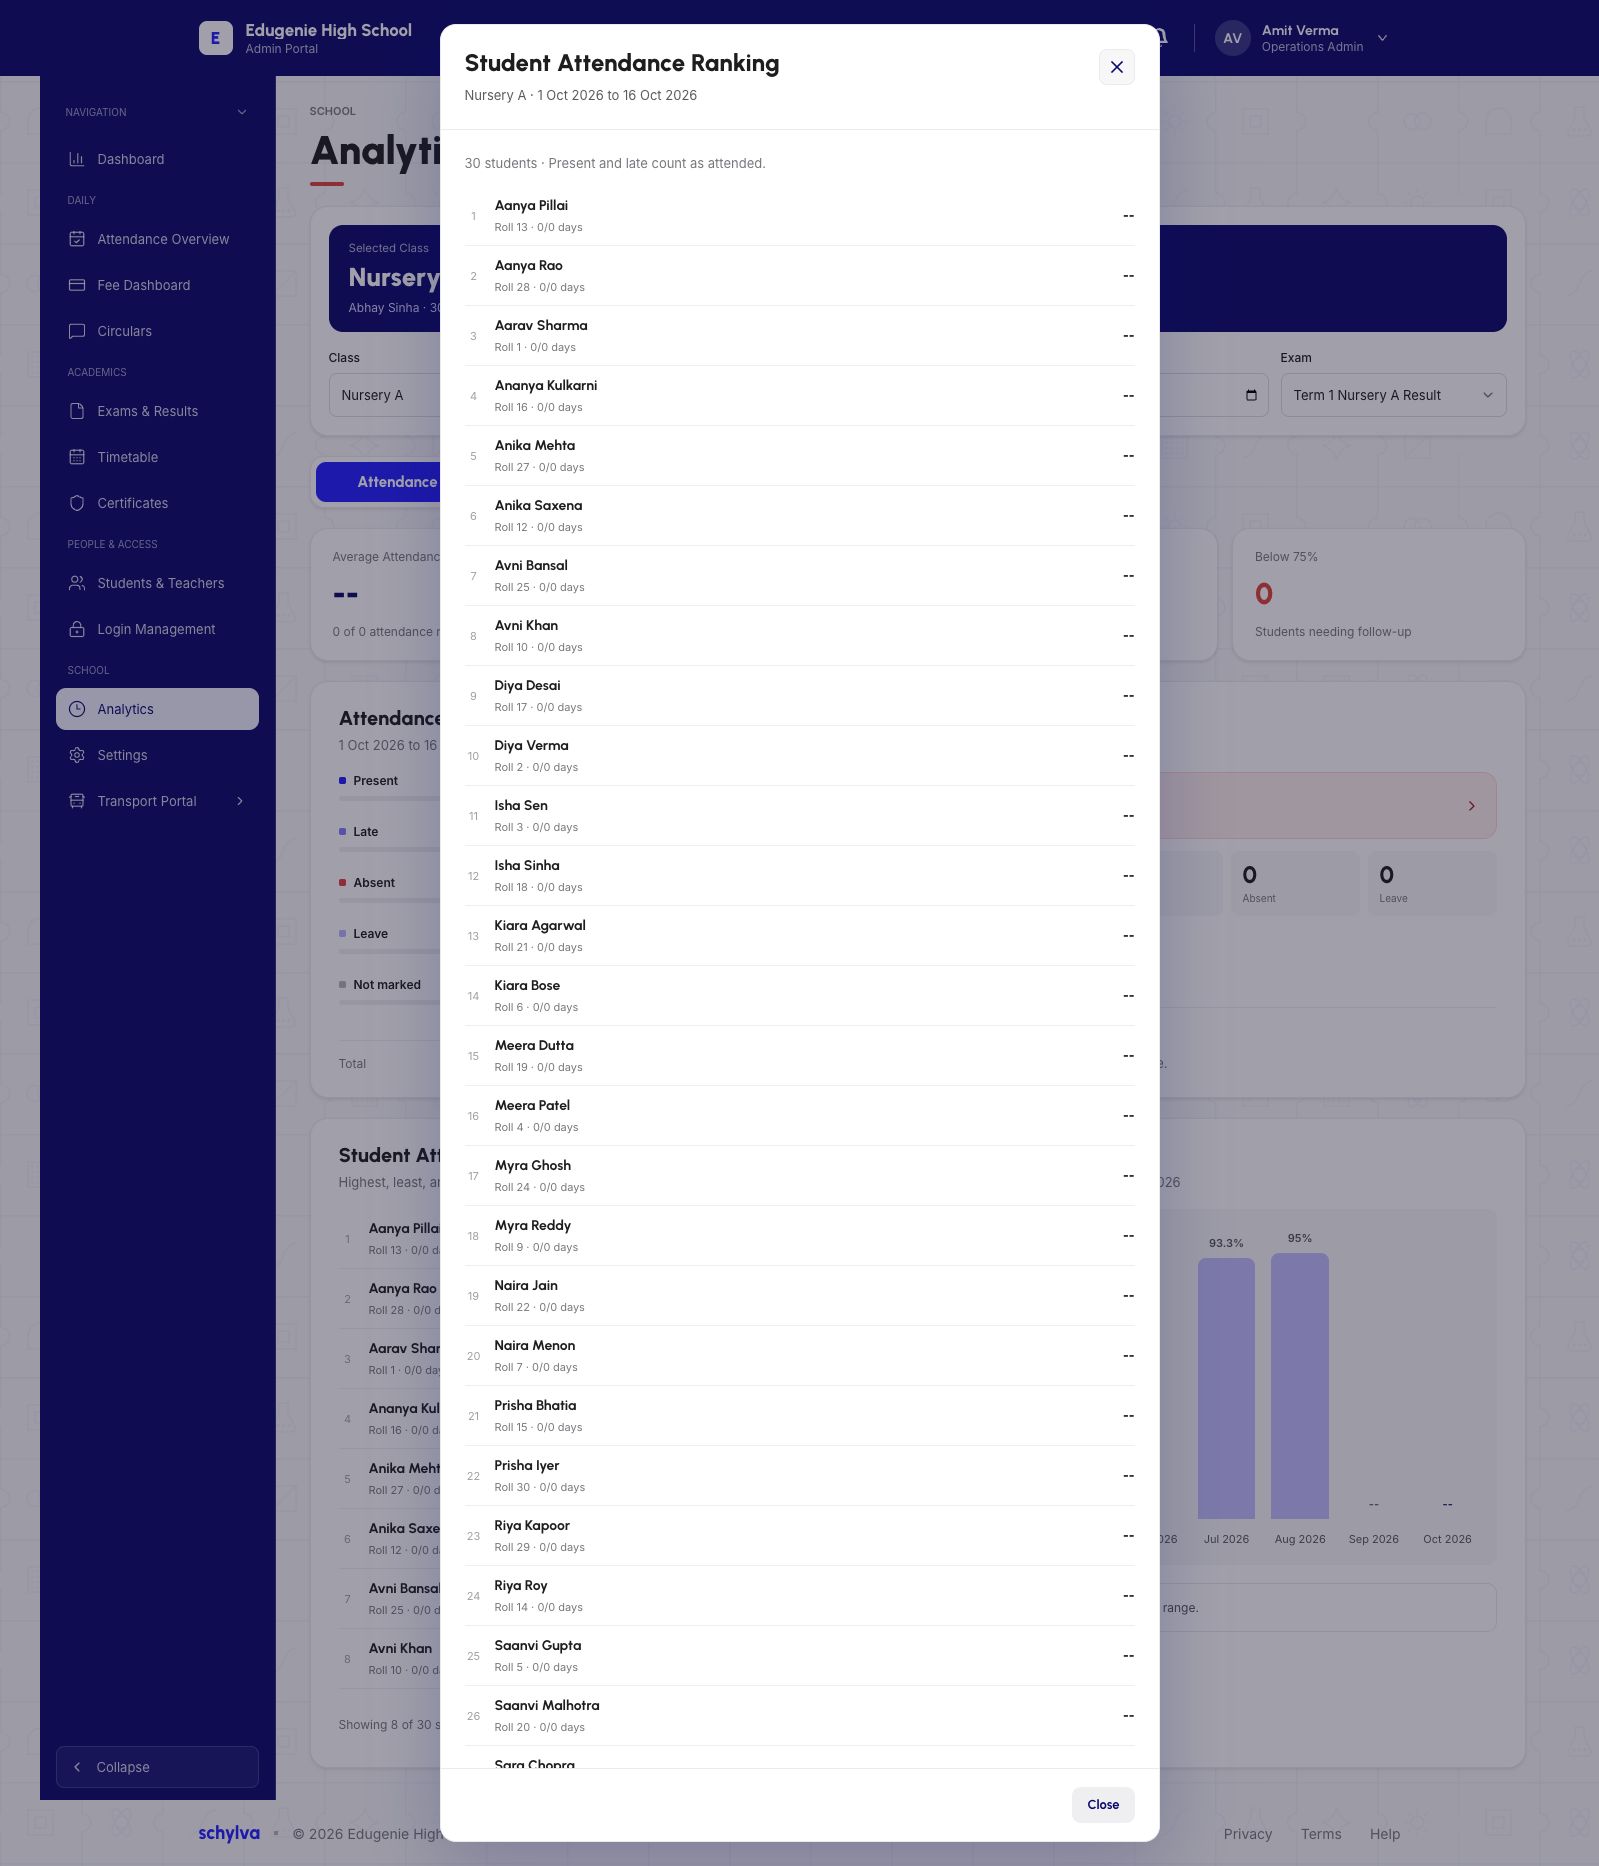
Open the full attendance ranking when you need the complete list. Check its date range and the number of students shown.
The captured ranking says Present and late count as attended. This is the displayed explanation for this view, not verification of every attendance formula or exception. Each visible row has 0/0 days and a dash for this period.
Demo · Admin desktop web
 View full screenshot
4. Read result coverage alongside the averages
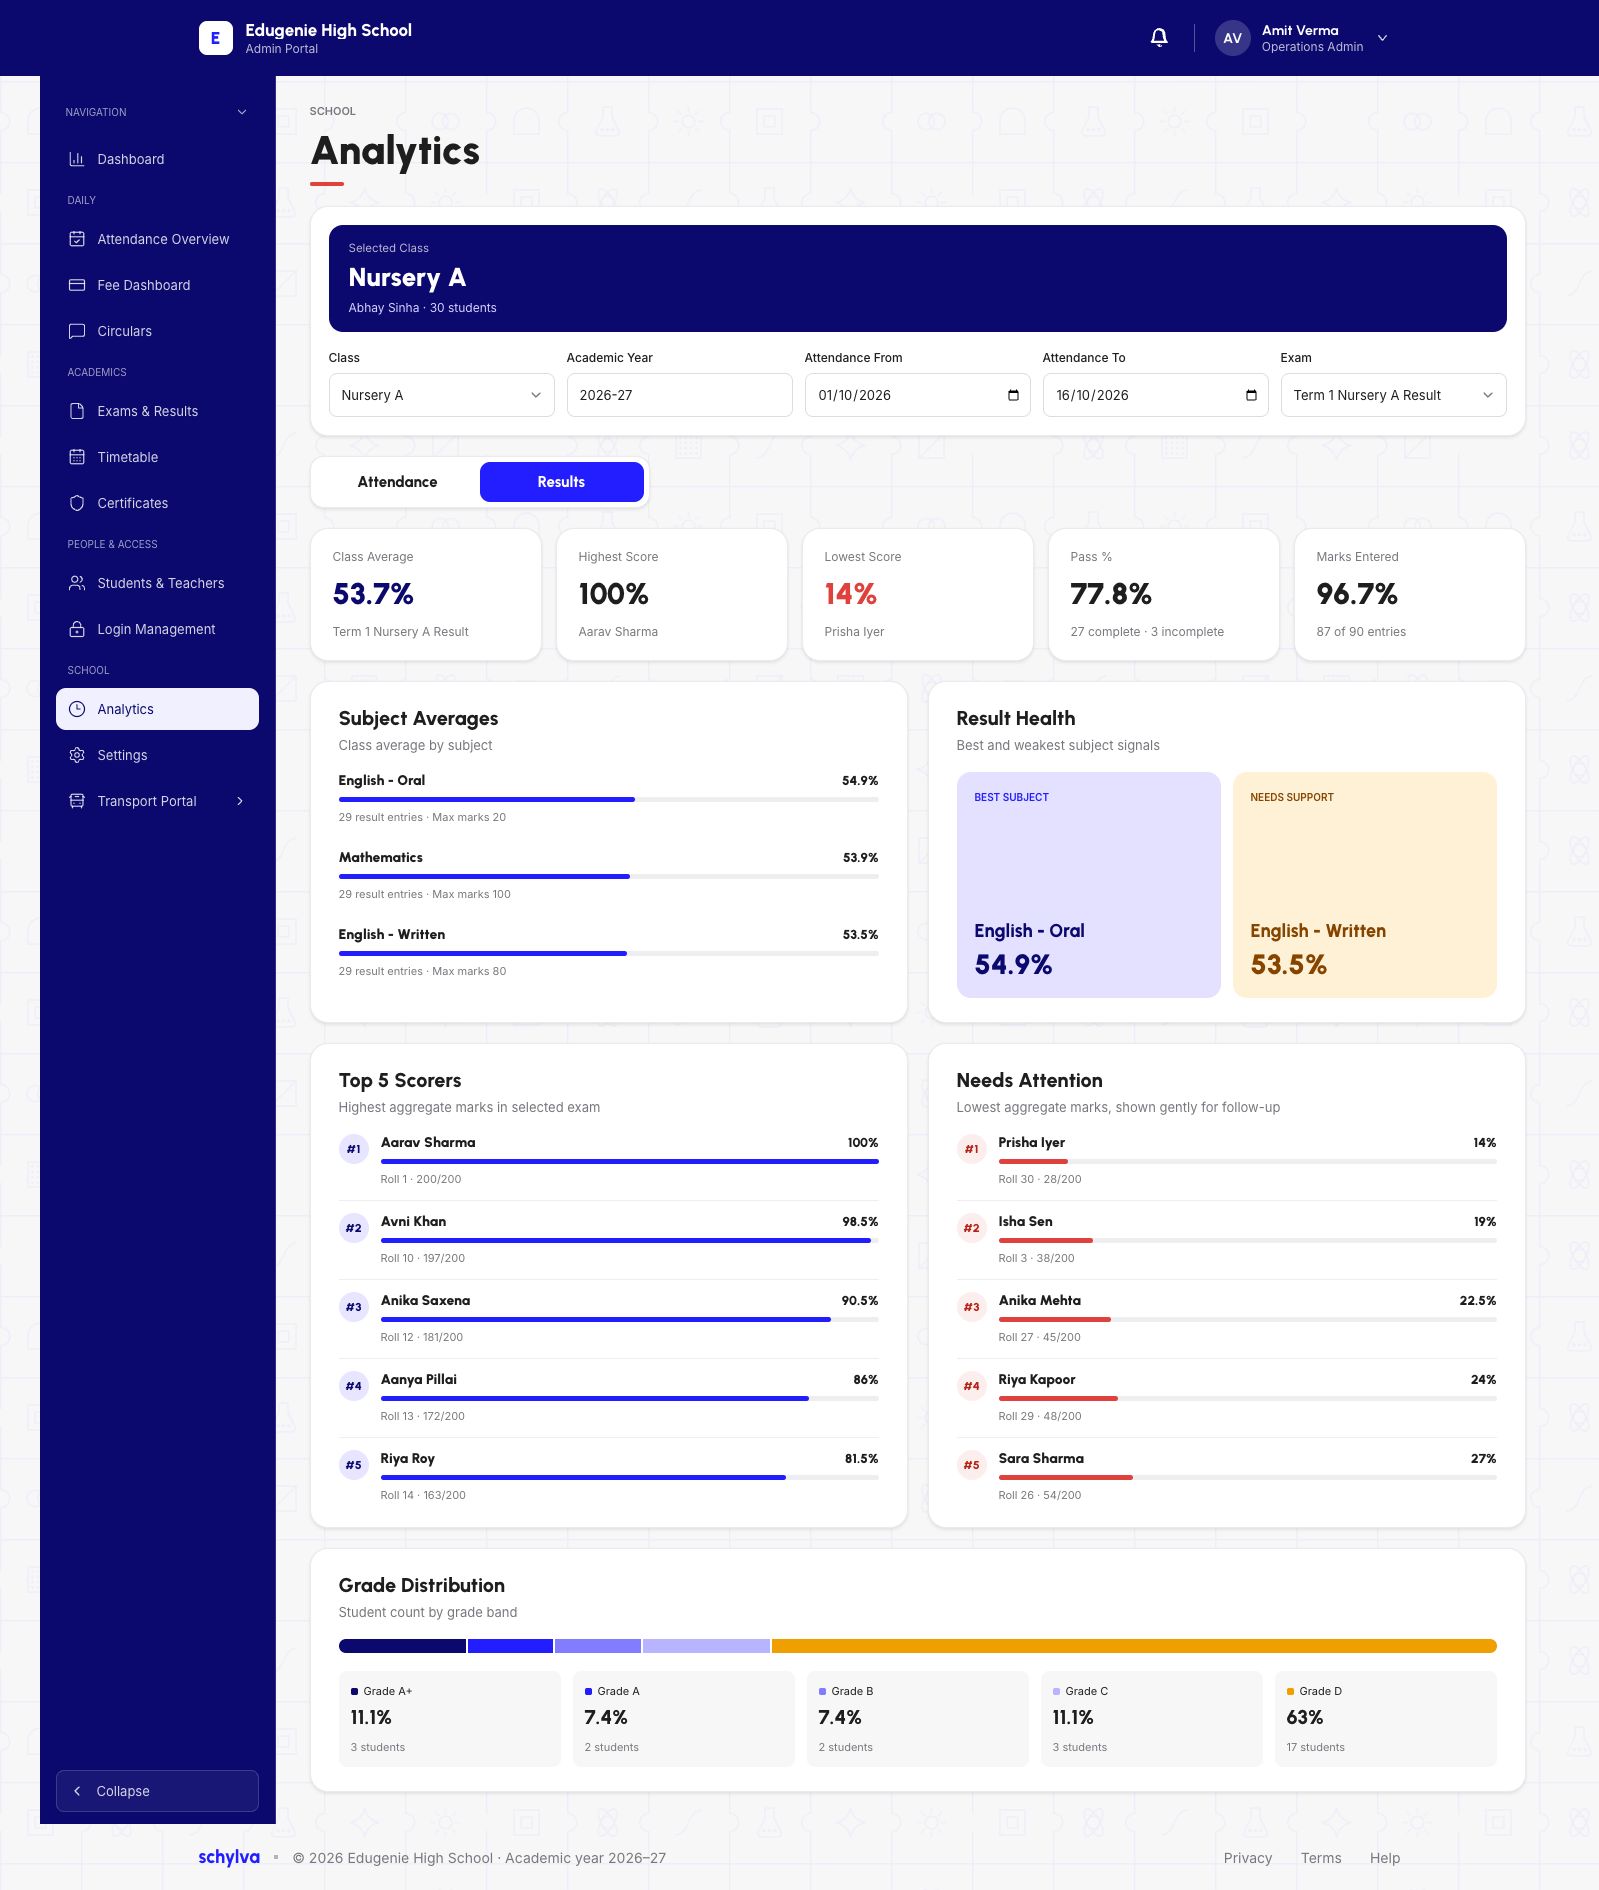
Switch to Results and confirm the Exam. The example uses Term 1 Nursery A Result. Read the class average, highest and lowest values together with completion counts.
The pass-percentage card shows 27 complete and 3 incomplete. Marks Entered shows 87 of 90 entries. Student completion and paper-wise entries are different measures; incomplete data should not be silently treated as zero.
Subject averages, Top students, Needs attention and Grade distribution help locate records to review. They do not independently establish why a student scored a particular mark or whether the underlying entries are correct.
Demo · Admin desktop web
 View full screenshot
If the analytics seem inconsistent
Check whether the panels use the same class, period, exam and unit.
- The trend has bars but the date-range cards are empty
- Compare the trend’s academic-year range with the selected attendance dates.
- Pass percentage and grade distribution differ
- Read the separate completion, grade-band and pass-threshold definitions; do not compare their counts as equivalent.
- A figure still needs explanation
- Ask the school administrator to inspect the source register or result set before changing records.